Pools
A pool is a scheduling and access boundary: a set of nodes, members, buckets, and models that belong together. A training job only ever combines nodes from a single pool. The pool switcher at the top of the sidebar scopes the whole UI to one pool.
Pool detail — /pools/{id}
The page for a single pool. Owners/admins get management controls; members get a read‑only view of most sections.
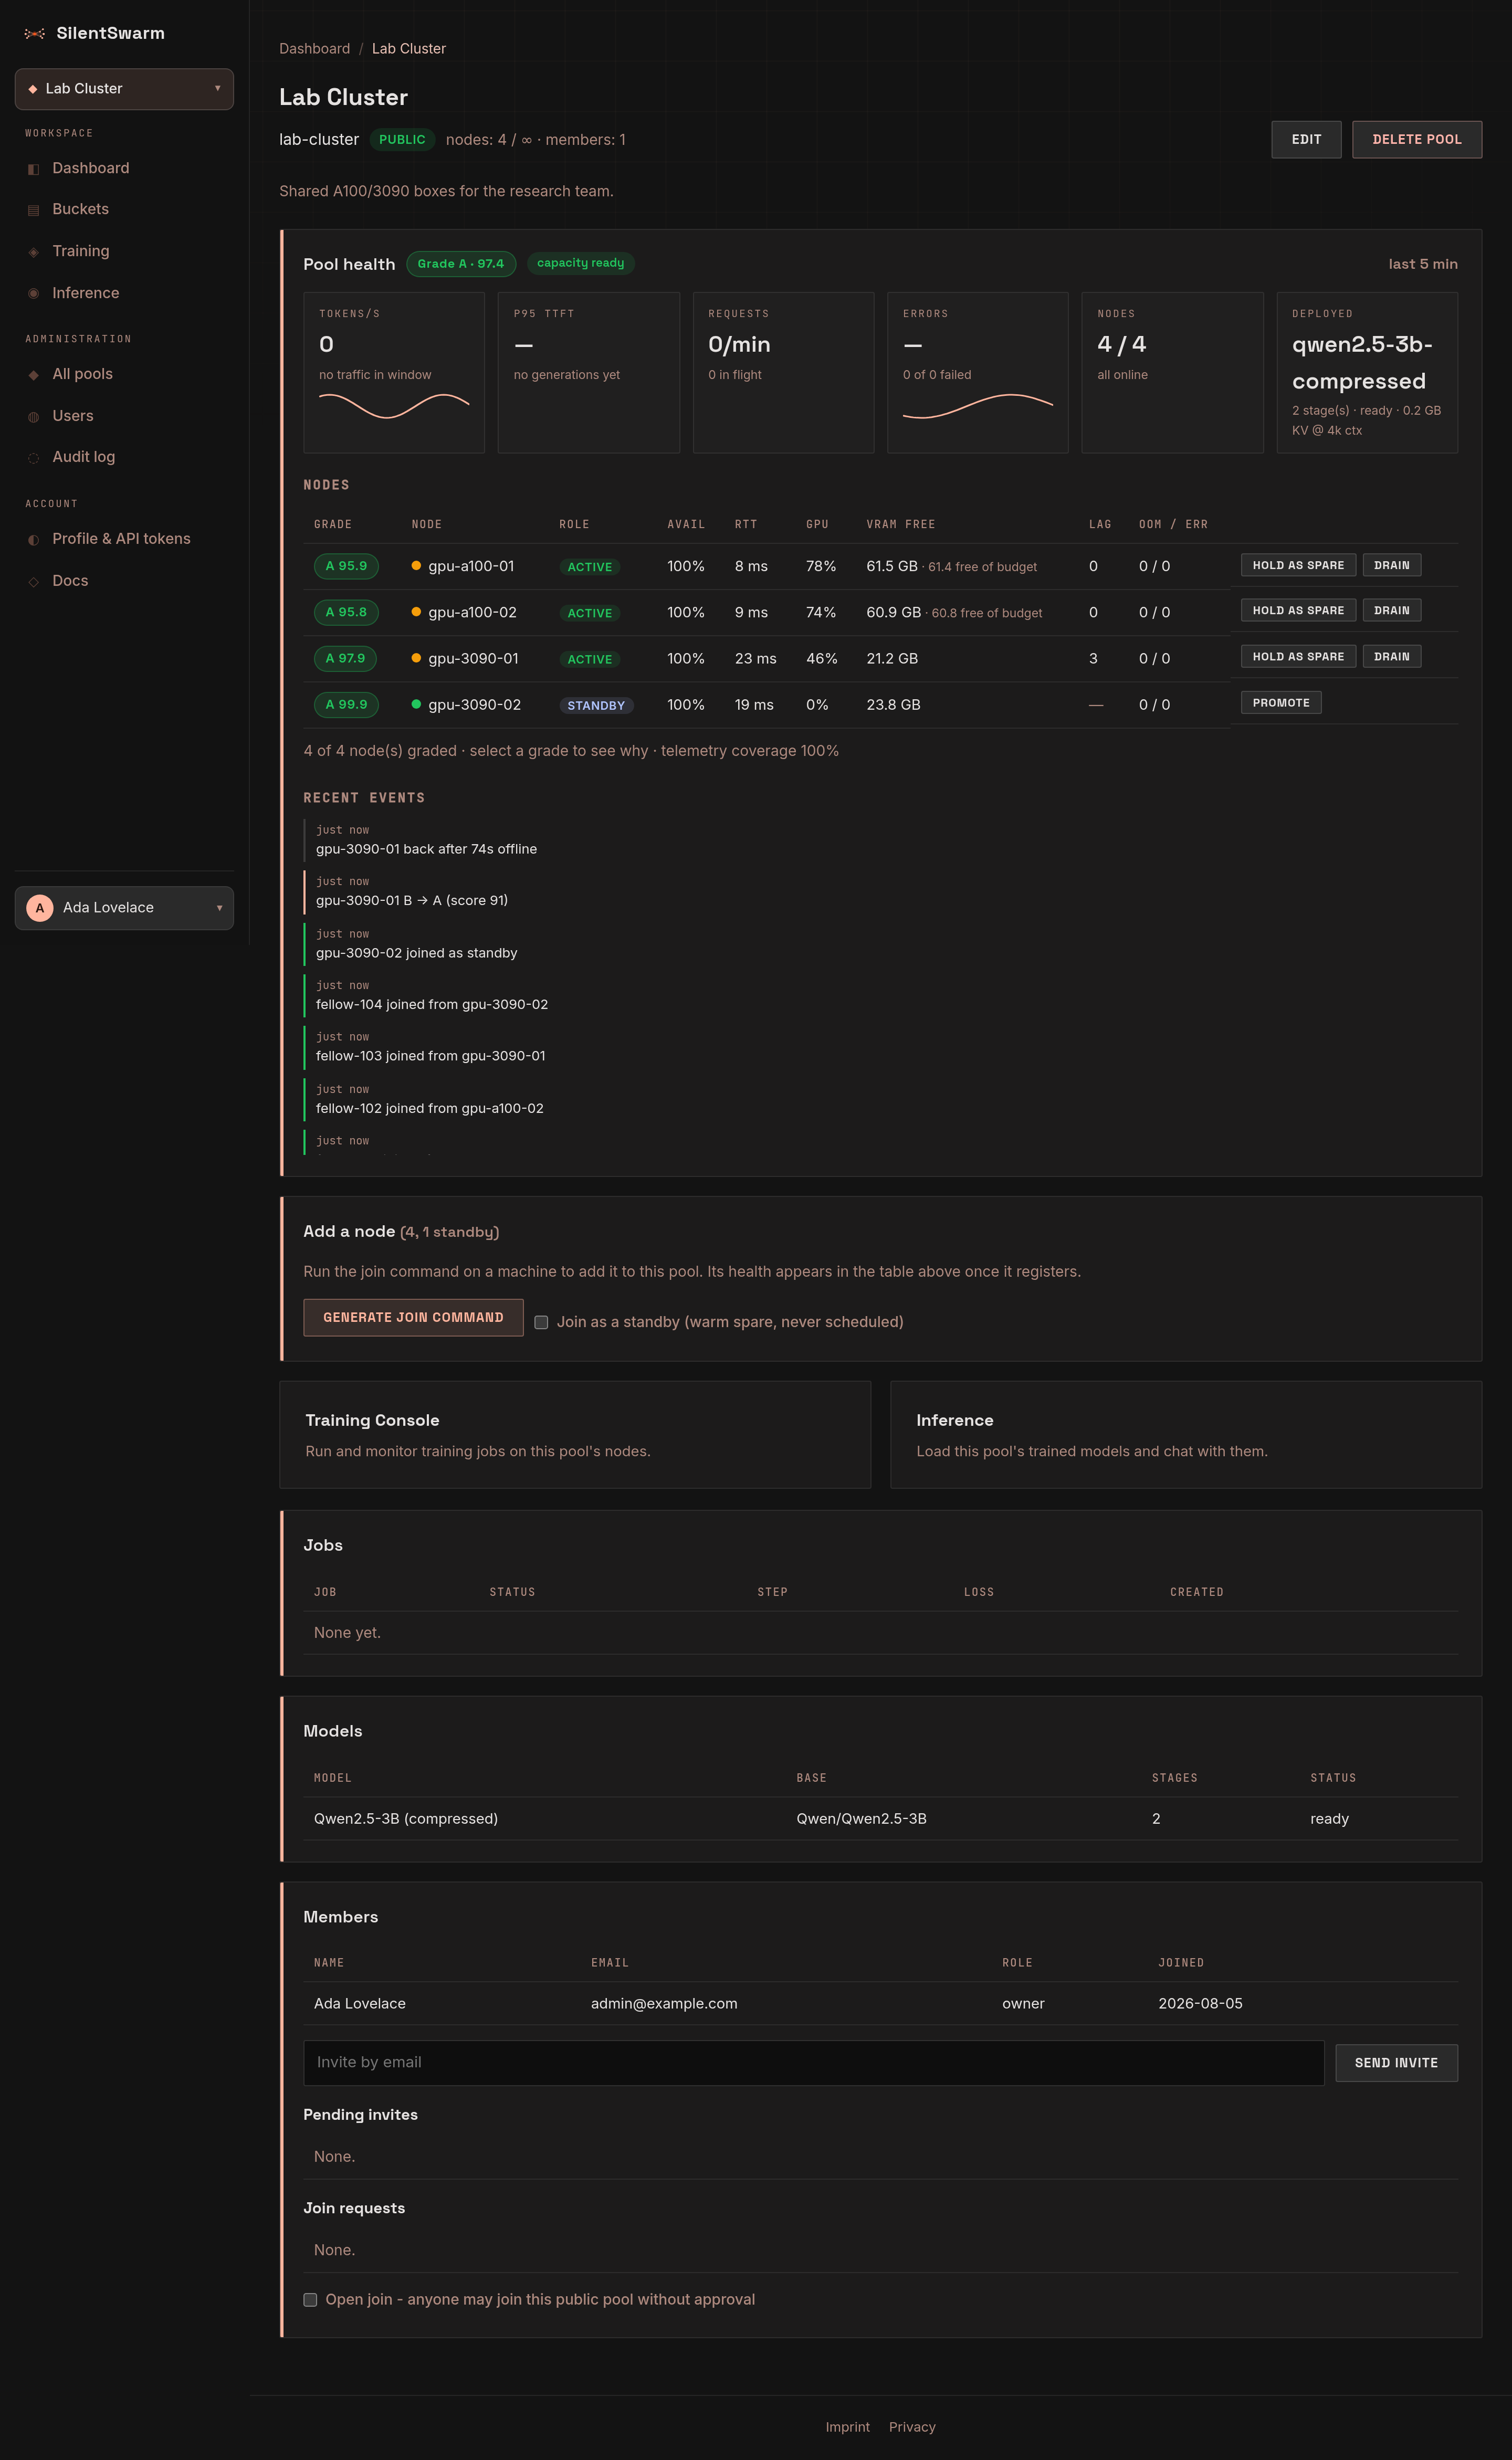
Top to bottom:
- Header — slug, visibility (public/private), node count vs. quota, member count, and description. Edit / Delete pool for owners.
- Pool health — the pool as a system: grade, KPI tiles, the graded node table and the event feed. This is where the machines are listed now, and where you change a node's role. See Pool health below.
- Add a node — Generate join command produces the pool‑scoped
curlto run on a new machine; tick Join as a standby to have it arrive as a warm spare rather than a schedulable node. The count next to the heading tracks how many nodes the pool holds and how many are spares. - Training console / Inference — shortcuts scoped to this pool.
- Jobs — training runs on this pool's nodes, with status/step/loss.
- Models — models trained in this pool and their serving status.
- Members — who belongs, with role and join date. Invite by email, review Pending invites and Join requests, and toggle Open join so anyone may join a public pool without approval.
Pool health
The pool page opens with a Pool health card that describes the pool as a system rather than as a list of machines.
- Grade next to the heading — an A–F letter with a 0–100 score, rolled up from the per‑node grades. capacity ready says whether every stage of every deployed model is loaded on a node that is still online.
- KPI tiles — tokens/s, p95 TTFT, requests/min, error rate, nodes online/total, and the deployed model. The first four carry an hour‑long sparkline drawn from the stored history, so a reload does not lose the trend.
- Node table — one row per machine: grade, role, availability, round trip,
GPU utilization, free VRAM, straggler lag and failure counters. Select a
grade to see why: the breakdown shows every component with the raw number
behind it (
fellow-reported leader RTT 11.5ms vs 50ms target) and any penalties. Owners and admins get the role actions on each row - Hold as spare, Drain, Promote - so a machine can be taken out of scheduling without being removed from the pool. - Recent events — node joins, drops, returns and grade changes, so a dip in a chart can be lined up with what happened.
How a node is graded
A weighted score over five components — availability (0.30), reliability
(0.20), latency (0.20), throughput (0.15) and capacity (0.15) — minus penalties
for flapping, crash loops, straggling and out‑of‑memory events. Override the
weights with SWARM_GRADE_WEIGHTS (JSON, renormalised automatically).
Three rules keep grades trustworthy:
- Unknown is dropped, not zeroed. A component a node cannot report is removed and the remaining weights are renormalised, so a machine is never punished for a signal it cannot produce.
- Evidence is required. A node needs at least one behavioural signal (availability, reliability, latency or throughput) before it is graded at all; free VRAM alone describes a machine that has not done anything yet. Until then it shows —, which is a different statement from a bad grade.
- Bands hold still. A band change must persist for
SWARM_GRADE_DWELL_Sseconds (default 120) before it takes effect, so a score oscillating around a boundary does not churn. The pending band is shown asB →C. Going offline is exempt: that is a fact, not a noisy sample, and grades F immediately.
Pool grades also appear as a pill on each dashboard pool tile, and as a coloured ring around each node in the training console's swarm graph.
Node roles and standbys
Every node in a pool holds one of four roles:
| Role | Meaning |
|---|---|
| active | Schedulable. Jobs are placed on these nodes. |
| standby | Registered, warm and never scheduled — a spare held in reserve. |
| draining | On its way out of service; no new work is placed on it. |
| quarantined | Taken out by an operator or by policy, kept registered for diagnosis. |
Add a spare by generating a join command with role: "standby":
curl -X POST https://<leader>/api/v1/bootstrap/join-sessions \
     -d '{"pool_id": "<pool-id>", "role": "standby"}'
Owners and admins can move a node between roles from the Pool health node table, or via the API:
curl -X POST https://<leader>/api/v1/pools/<pool-id>/nodes/<fellow-id>/role \
     -d '{"role": "standby"}'
Two things worth knowing: a standby counts against the pool's node quota (it occupies a slot in your cluster whether or not it is working), and it is graded without the throughput component — an idle spare is doing exactly what it is held in reserve to do, so it is not marked down for producing no tokens.
Automatic replacement
When a pool holds standbys, the leader can replace a failing active node on its
own. This is off by default (SWARM_AUTO_REPLACE=0): in dry-run mode the
policy still evaluates every minute and writes what it would have done to the
pool timeline, so you can read a week of its intentions before letting it act.
Triggers, each of which must hold for a dwell time before it counts:
| Trigger | Default dwell | Env |
|---|---|---|
| No heartbeat | 60 s | SWARM_REPLACE_OFFLINE_S |
| Grade F | 120 s | SWARM_REPLACE_GRADE_S |
| Straggling ≥ 5 steps behind | 300 s | SWARM_REPLACE_STRAGGLER_S |
| ≥ 3 out-of-memory events | immediate | SWARM_REPLACE_OOM_S |
| ≥ 5 re-registrations in 24 h | immediate | SWARM_REPLACE_FLAP_S |
When one fires, the leader picks the highest-graded standby with enough free VRAM for the failing stage, checkpoints the running job, quarantines the failing node, promotes the standby, and hands the job back to the scheduler to be re-placed and resumed from that checkpoint. Every step is audit-logged and appears in the pool's event feed.
Guards, all of which have to pass:
- One replacement in flight per pool, plus a cooldown afterwards
(
SWARM_REPLACE_COOLDOWN_S, default 300 s). - Never promote an ungraded node (no track record) or one that was previously quarantined — that needs a human to clear it.
- Never quarantine a node when no standby can take over: turning a degraded pool into a dead one is not an improvement.
- A failed checkpoint aborts the swap; nothing moves.
Alerts
Set SWARM_ALERT_EMAILS (comma-separated) and/or SWARM_ALERT_WEBHOOK to be
told when a node is quarantined, a standby is promoted, or a pool's capacity is
no longer ready. Repeats of the same alert for the same node are suppressed for
SWARM_ALERT_REPEAT_S (default 30 min) so a flapping machine cannot train you
to ignore the alerts.
Serving VRAM
Loading a model onto a pool costs more than its weights: each pipeline stage
also keeps a KV cache for the layers it holds, sized by the context length you
serve. The leader budgets both before it loads anything, and refuses a
placement that cannot hold them — stage 0 on gpu-1 needs 15.2 GB (9.0 GB
weights + 4.8 GB KV cache at 8192 tokens), has 12.0 GB free — rather than
letting the node run out of memory once real requests arrive.
The node table's VRAM free column carries the budget as a tooltip, and the
deployed‑model tile shows what the cache costs at your configured context. Set
that context with SWARM_SERVE_CONTEXT_TOKENS; the budget scales linearly with
it, so halving the context halves the cache.
Models exported before this existed do not record their attention shape. They are admitted on weights alone — and the budget says so rather than pretending the cache is free — until their first successful load, which teaches the manifest the shape for every load after that.
Pool metrics
Every pool exposes a live health snapshot describing it as a system, not as a list of machines. Any member of the pool can read it:
curl -s https://<leader>/api/v1/pools/<pool-id>/metrics | jq
The payload has four parts:
pool— nodes online/offline/training, GPUs, aggregate VRAM and RAM, mean GPU utilization, current step, worst straggler lag, average loss, mean availability, and control‑plane RTT.serving— over a rolling window: tokens/s, requests/min, error rate broken down by class (fellow error, timeout, client disconnect, model not loaded), p50/p95 time‑to‑first‑token, p50/p95 queue wait, mean inter‑token gap, and in‑flight requests.deployed_models— which models are loaded, on which nodes, in how many stages, and one overall state per model (the worst any stage reports, so a model with one stage still loading is not "ready").nodes— one row per machine: availability, heartbeat age, control‑plane and leader round trips, GPU utilization/temperature/power, VRAM, step rate, stall seconds, straggler lag, OOM/error/restart counters, and its slice of the serving traffic.
Each node row also carries its grade — score, band, the components it was
built from, and any penalties.
GET /api/v1/pools/<pool-id>/metrics/stream is the same payload as a
server‑sent event stream for live dashboards.
History. GET /api/v1/pools/<pool-id>/metrics/history?metric=tokens_out_per_s&window_s=3600
returns a stored series, optionally for one node (&fellow_id=). The leader
rolls metrics up once a minute, keeps minute resolution for 7 days, folds older
points into hourly means for 90 days, and buckets every response down to
max_points (default 200) — so a 90‑day window costs no more to read than an
hour does.
Events. GET /api/v1/pools/<pool-id>/events returns the pool timeline:
nodes joining, leaving, dropping offline, returning, and grade changes.
A signal a node never reported is null, not 0 — a machine that cannot read
its own power draw is not the same as one drawing no power. Nodes that just
joined report null availability until they have been observed long enough to
say something honest.
Pools admin — /admin/pools
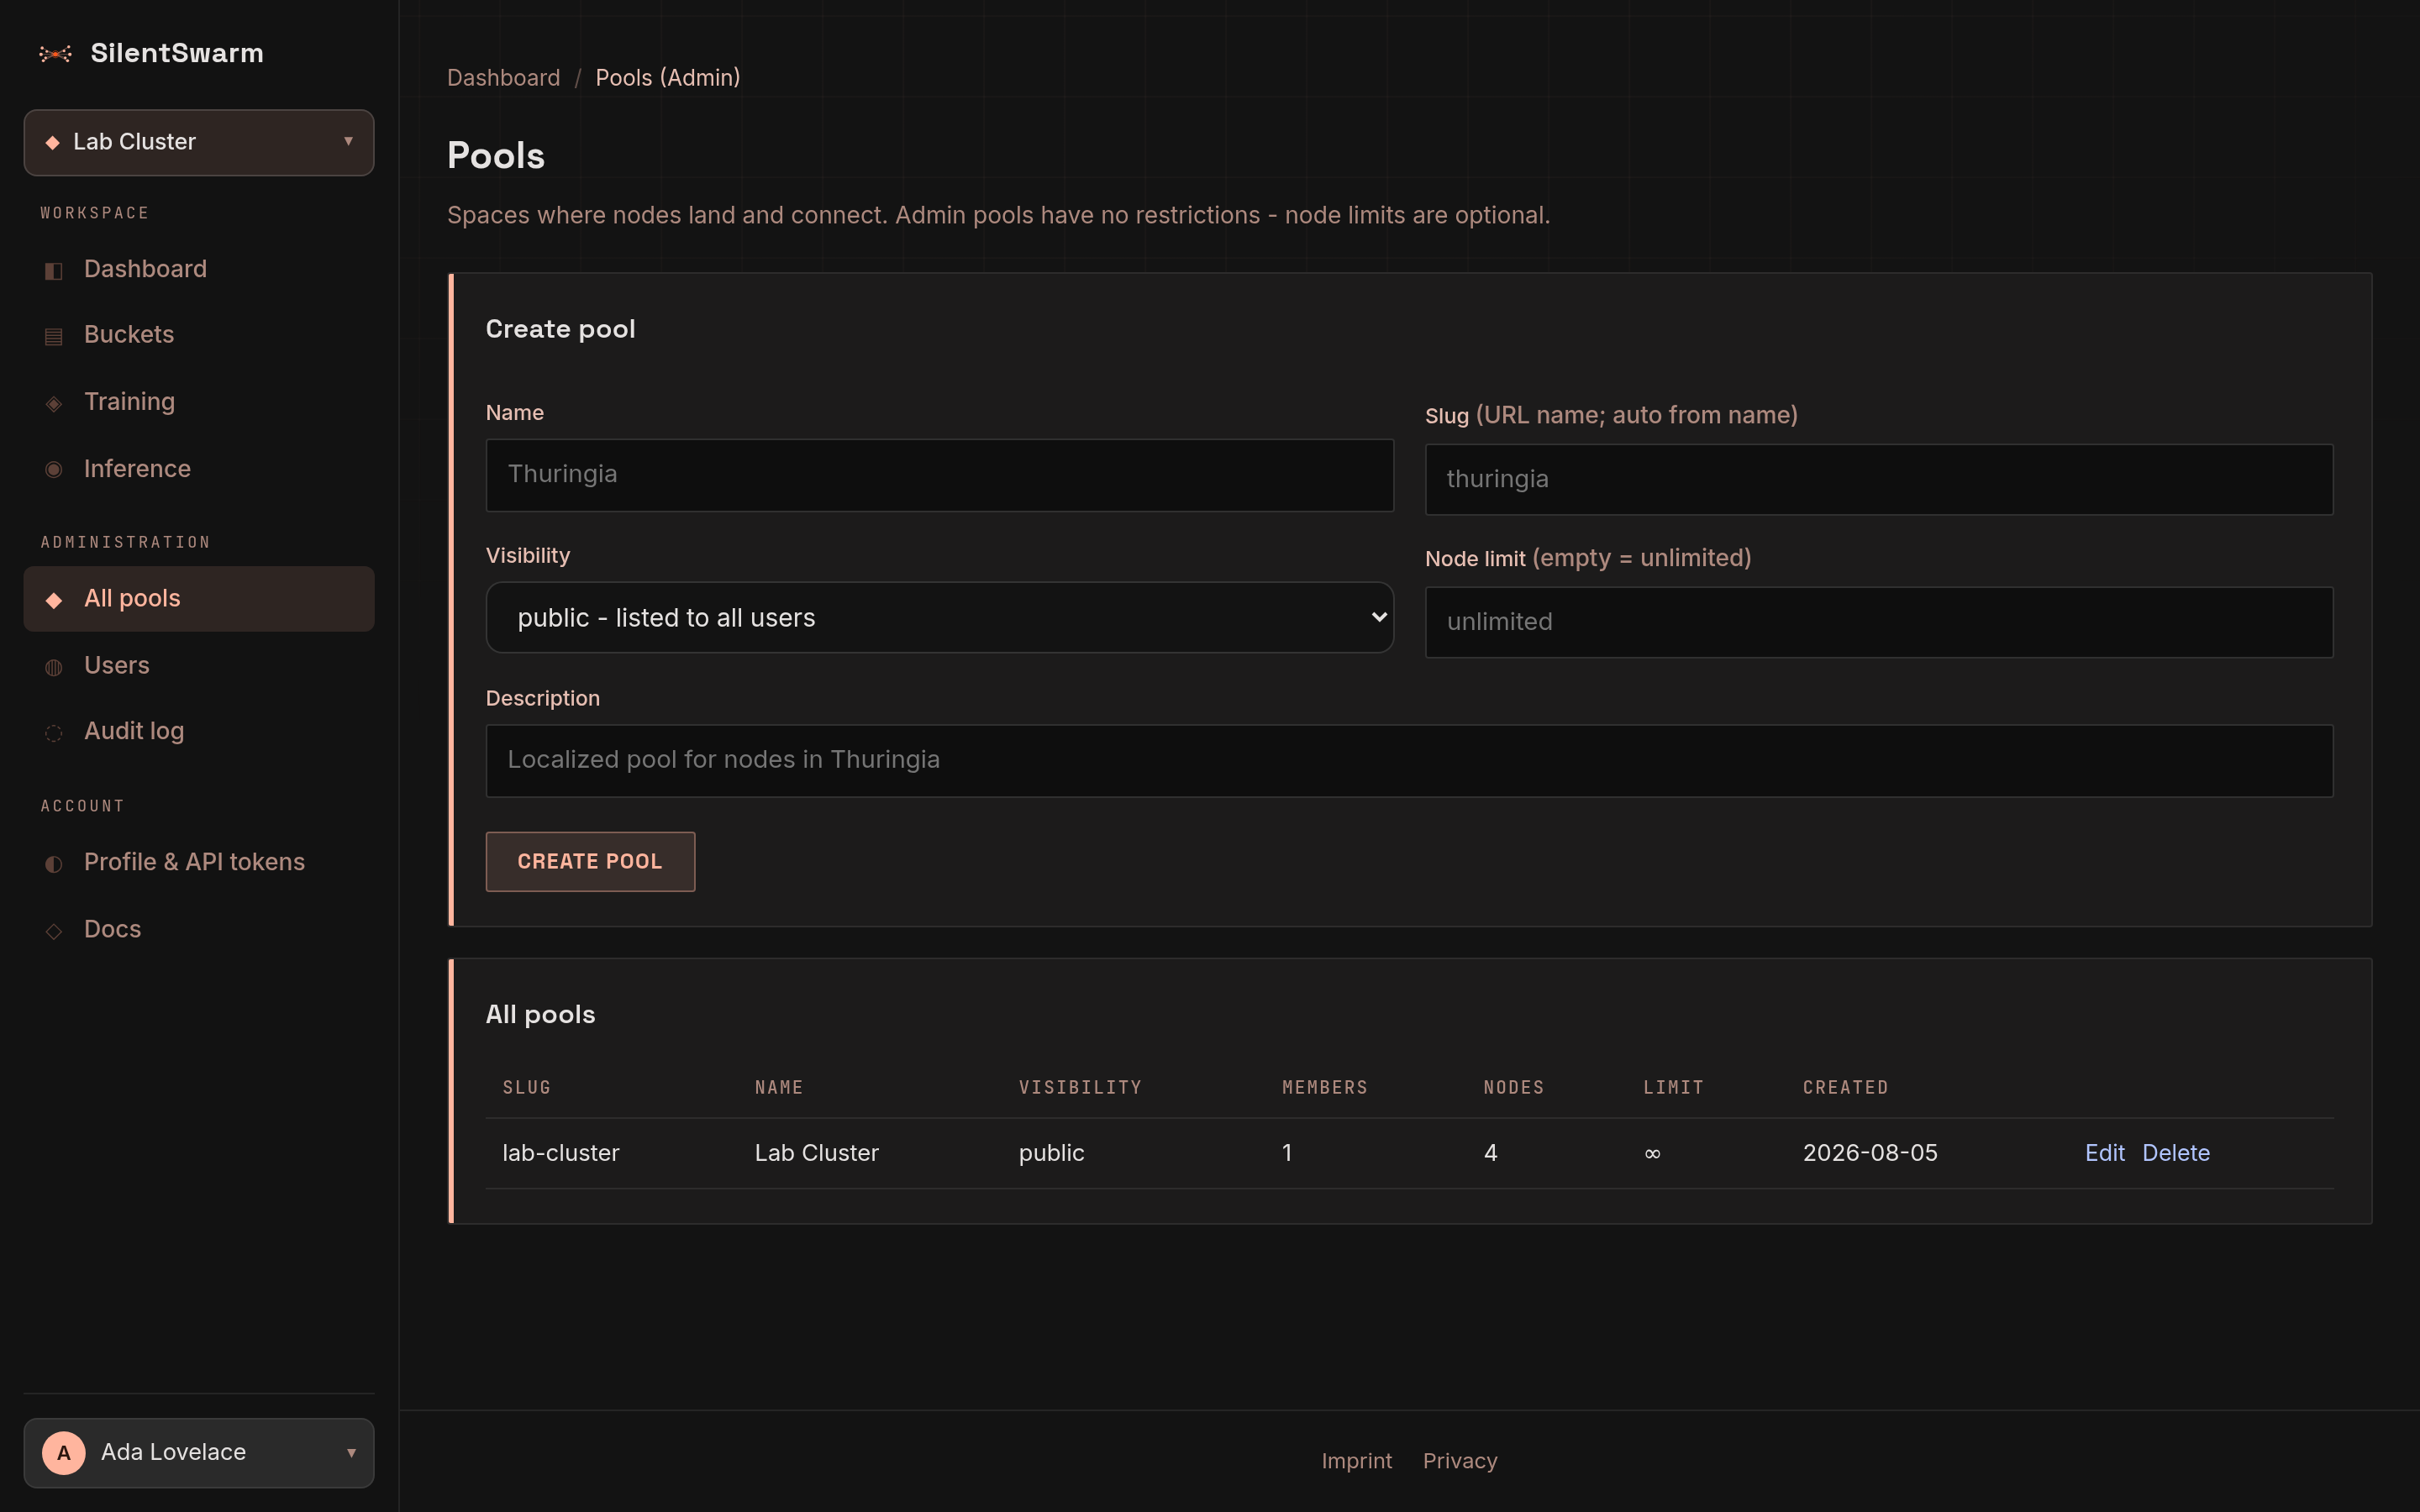
Admin‑only overview of every pool on the leader (not just the ones you belong to): create pools, inspect membership and node counts, and manage or delete any pool. Regular users manage their own pools from the dashboard and the pool detail page instead.